Codescape Diaries: 02
(this is part of a series: find the previous post here)
So now that I’m collecting all this data, what am I doing with it?
Let’s start with my goals:
- Take a repository and find code that needs to be look into/refactored
- Communicate to our PM when we need to address tech-debt
So I’m catering to two very different kinds of users. Developers want to see exactly which files to look at. PMs just want a high-level value to track over time.
In my first iteration I built both of these views.
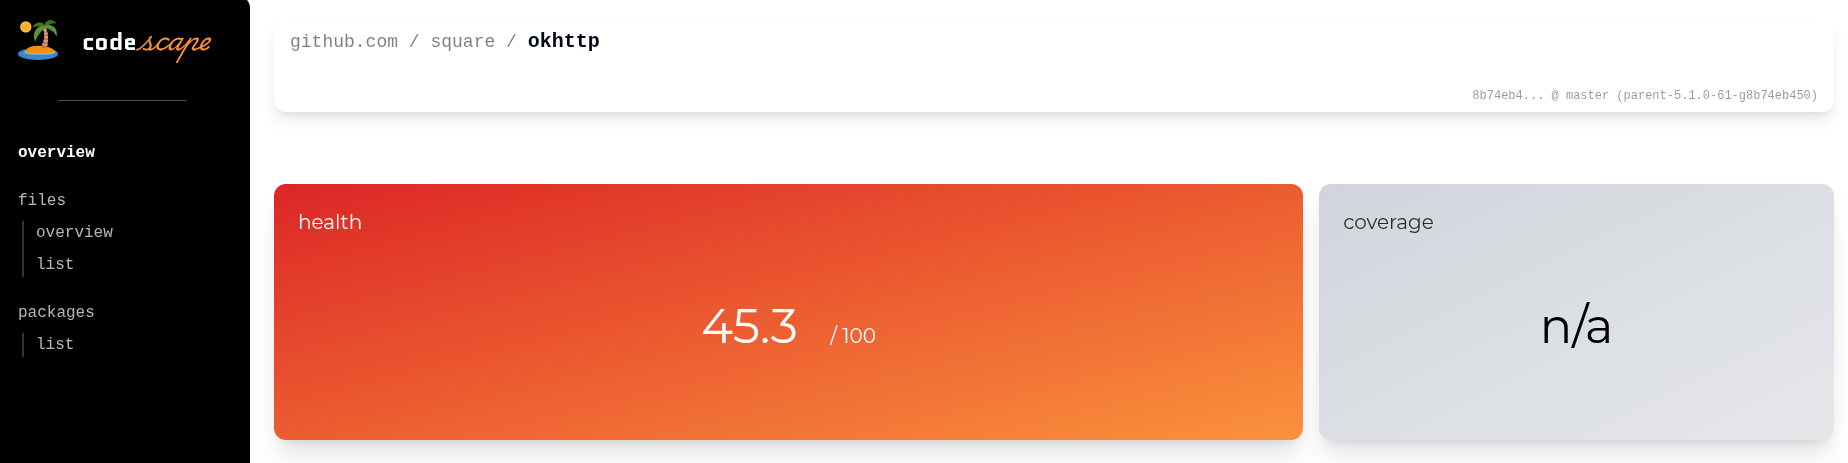
A high level measure of health for our PM
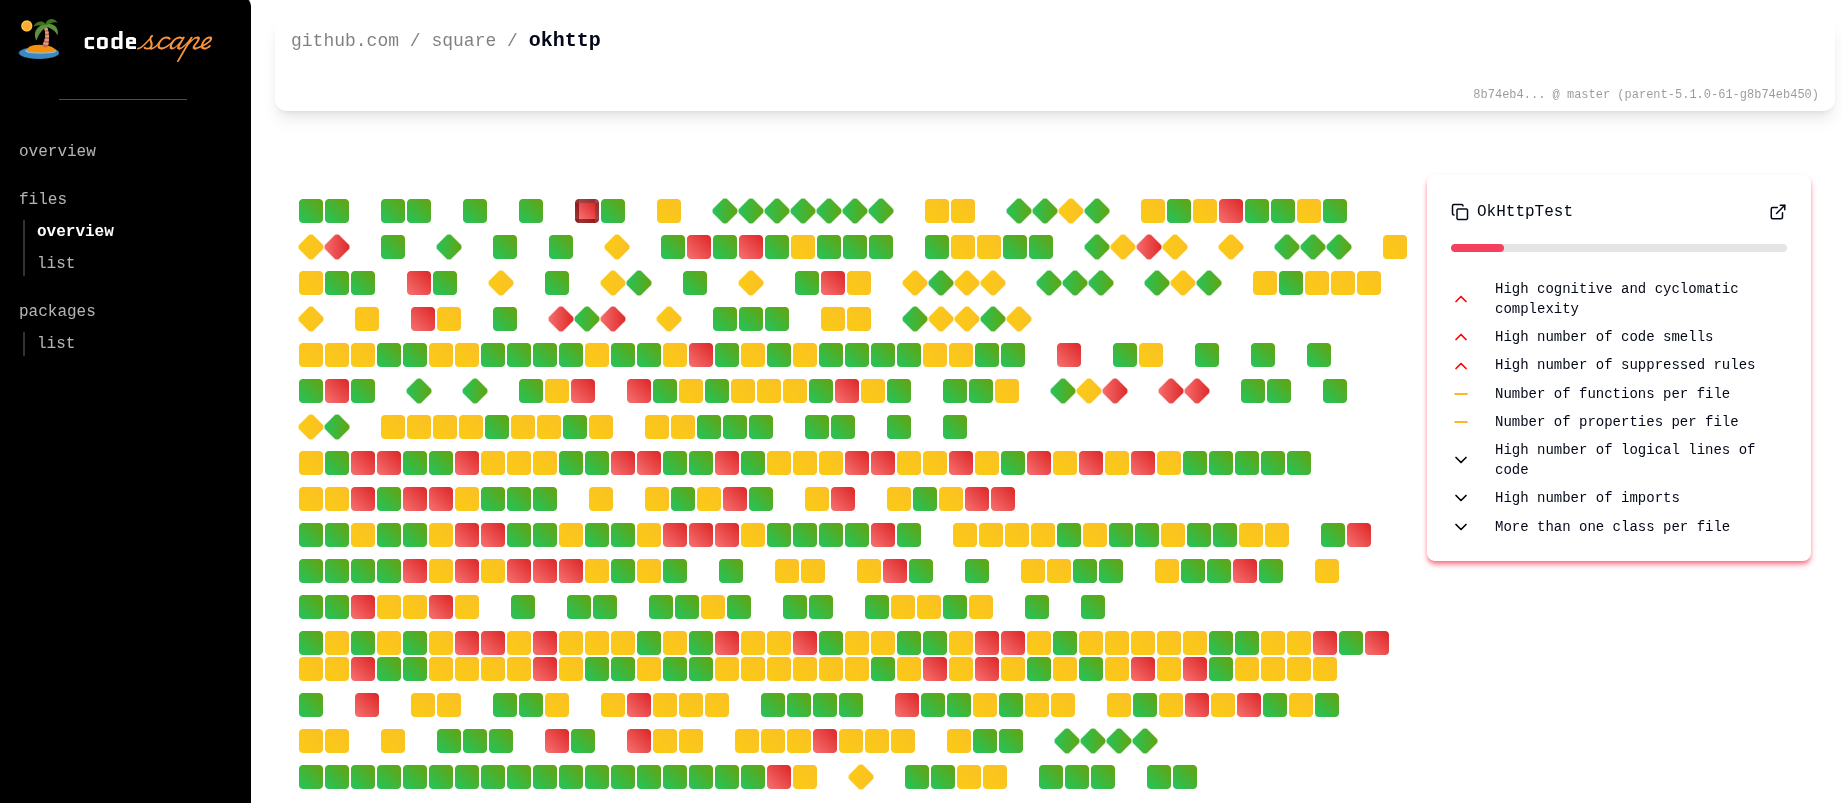
And a detailed file view for developers (with a list of things they may want to “fix”)
❤️🩹 Old health score
For this post lets focus on the high-level health score.
In my first iteration I did this by creating a bunch of rules I would run these file metrics through. These rules would spit out a 3 level result: ”🟢”, ”🟠”, ”🔴” that would then get normalised against all other rules based on a rule weight.
But I later felt that these rules included things that were more a personal preference (for example, long file names) and the rule weights we very arbitrary based on my own opinions. I did consider allowing people to set up their own rules and weights, but then I lose the ability to easily compare one project to another (all while building a lot of complexity along the way).
So now I’m taking a different approach: I’m focusing only on two very concrete metrics: code size & code complexity.
I will likely add more as I build this out, but I wanted to get some solid metrics to start with. And while I don’t think we can agree on how long variable and function names should be, I think we can agree that less code is better*, and less complexity is better.
* I don’t mean that more concise code is better, but that less overall code is better - code always has risk, so less code = less risk
💚 New health score
I’ve completely changed my approach here: projects are made up of functions, so that is what I’m basing the score off.
For each function I calculate a health score based on complexity and code size. This is in the range of 0 - 100.
Once I calculate that for all functions, the final health score is a set of percentiles of all those function scores.
For example, the health score output of a project might look something like this:
"score": {
    "p50": 100.0,
    "p75": 100.0,
    "p90": 99.8959,
    "p95": 99.5593,
    "p99": 85.7881,
    "p999": 24.9494
},
A p99 value of 85 means that 99% of functions in this codebase have a health value of at least 85
This serves two purposes:
- Gives a quick overview of how much code has poor health
- Avoids having bad code hidden by lots of code code
That’s great, but how do I get to those numbers?
I went back and forth on this a lot (and will continue to do so). It’s the core of this tool, so something I’m spending a lot of time experimenting with.
I’ve gone through many different mathematical formulas to try to calculate how a given metric is turned into a score. I’ve tried linear interpolation, exponentials, logarithmic, etc. For now I’ve landed on a cos approach.
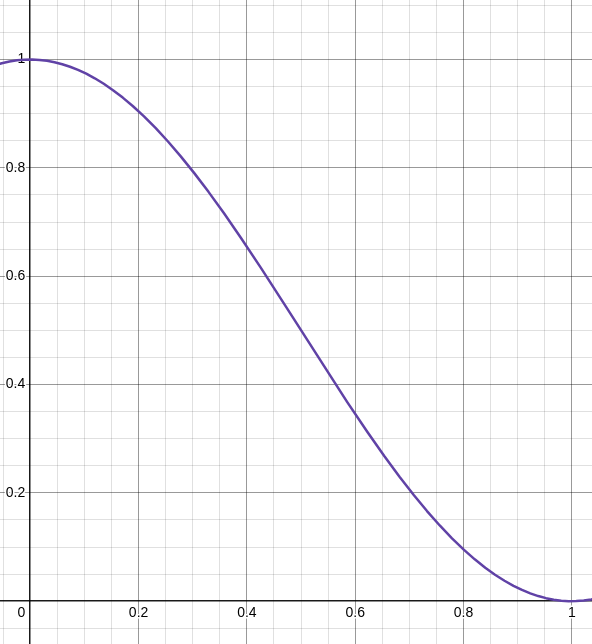
To use this formula I set an upper and a lower bound to the metric I’m measuring. For example, if I set the bounds for cyclomatic complexity to [3, 30], if a function has a complexity under 3, they have a full score, if it has over 30, it gets a score of 0. Anywhere in the middle, it fall somewhere on that line.
complexity: 0;  score = 100
complexity: 3;  score = 100
complexity: 10; score = 84
complexity: 25; score = 8
complexity: 30; score = 0
complexity: 50; score = 0
Of course I could keep it simple and just go for a linear interpolation between those two values. I did try that too. But I wanted to be more lenient towards lower complexity scores and more aggressive towards higher scores. You can see that in the graph if I add linear interpolation as another line:
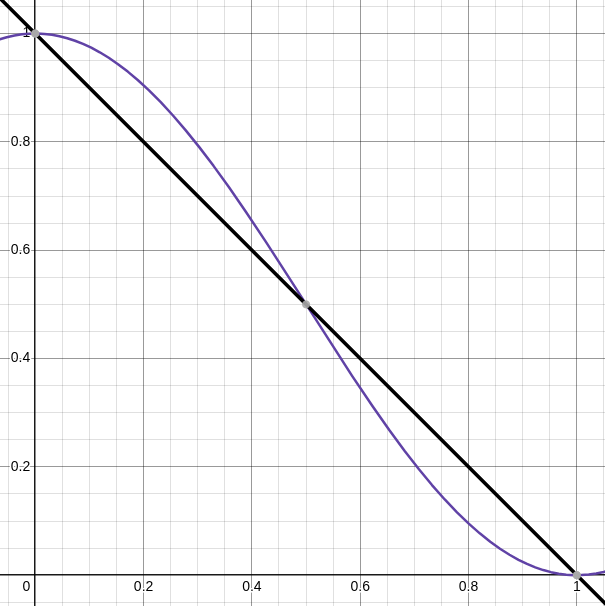
Up until the middle of the range scores will be higher than with linear interpolation. After the midpoint they will be lower.
📈 Next steps
This is working well so far, and I’m getting some interesting numbers. There are a few things to add though.
File scores
Since the calculation so far is all based on individual functions, you could have a project with one million perfect functions, but all in a single file, and you would get a perfect score. I don’t agree with that 🤔
So I will be introducing a way to penalise files that have a lot of functions.
Tweaking the numbers
I don’t currently have a very scientific way of setting the parameters for the health score calculation, it’s based on a gut feeling. So I will continue to play around with the numbers until it feels right.
The main thing I’m trying to do is focus on real things, not stylistic choices.
👋
// the end